School graphs
The school graphs present easy to understand graphs of acceptance results.
Graphs#
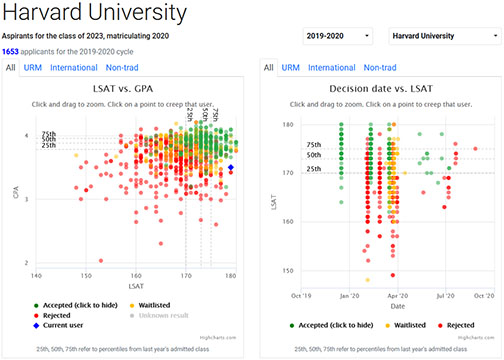
2019-2020 graph for HLS
The graphs show applicant results plotted against GPA and LSAT. The dotted lines on the graphs represent the 25/50/75th percentiles reported by the school in their ABA 509 report from the previous year.
Applicant tables#
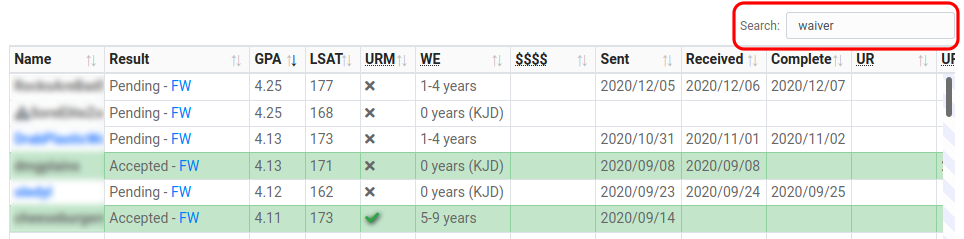
Searching for fee waivers in the applicant table
The applicant tables show in-depth information about every LSData user that applied to the school during the selected cycle. This includes application type, GPA, LSAT, scholarship info, and decision dates.
Filters and details#
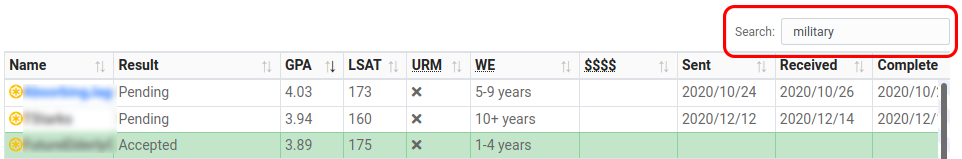
Searching for applicants with US military service in the applicant table
You can filter for detailed information such as fee waivers, scholarship negotiation, military service, character and fitness issues, etc. Just search for it in the table. Try searching for "military", "waiver", or "priority" to filter users in the table.
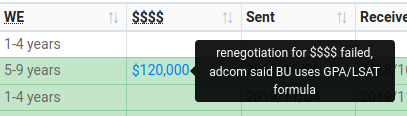
Hover to see in-depth scholarship details
Details can be accessed by hovering over the relevant field.